


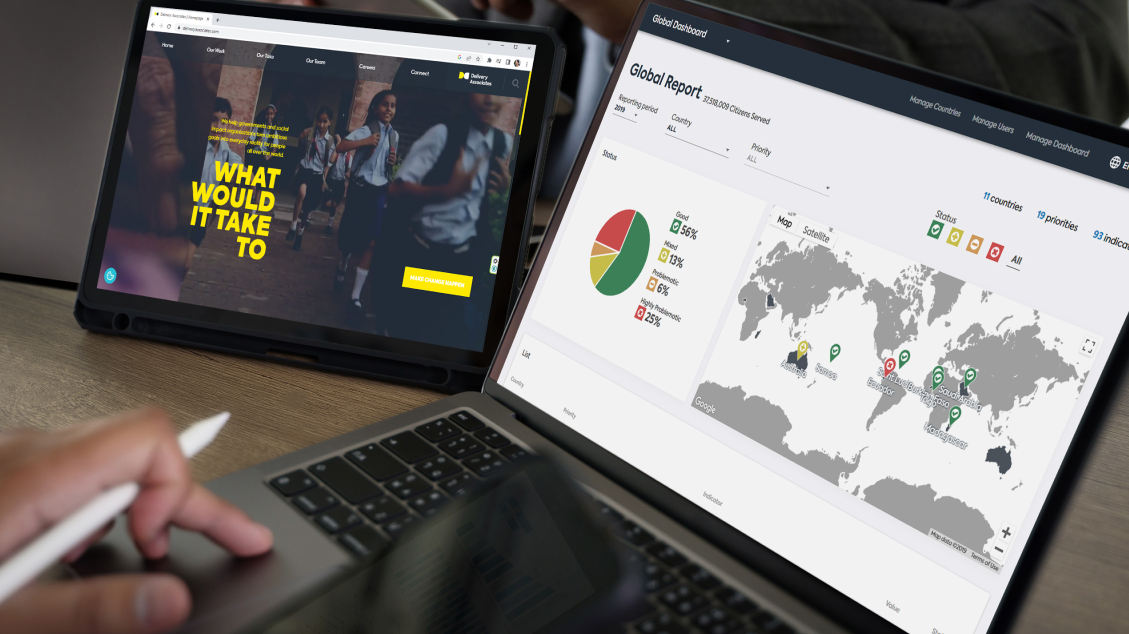
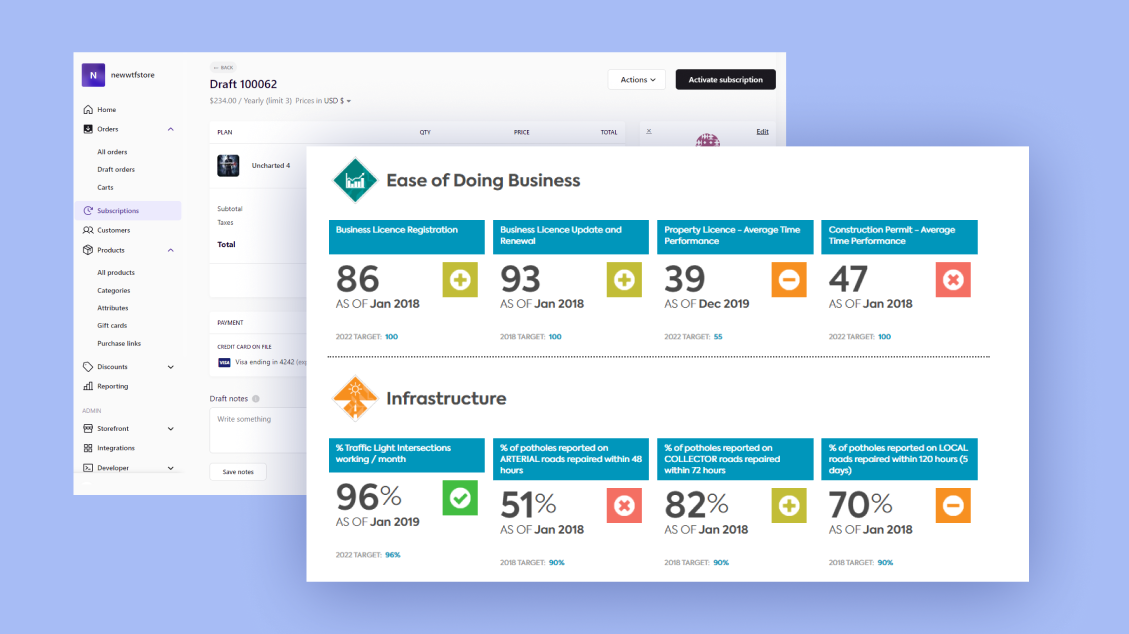
The dashboard we developed allows visualizing data about the implementation of government initiatives and incorporates a key performance indicator (KPI) system to track their results.


Delivery Associates (DA) is a public sector advisory group focused on implementation of large-scale reform and establishment of delivery management models (especially, creating Delivery Units within the government bodies).
DA created a system driven by data, technology, planning, and monitoring called Deliverology®, which helps leaders develop and implement meaningful policies.
Delivery Associates
Public sector
A custom dashboard
Amazon, Node.js, React Router
During our long and successful cooperation with the customer, we built custom dashboards relying on the Deliverology® principles both for DA clients and for internal use.
Our engineers developed a monitoring solution that unites data, fieldwork, targeted actions, and routines into an effective system. It is intended both to monitor and drive the progress made towards the stipulated targets in various spheres.
Governments and public institutions use this solution when planning reforms and implementing policy changes in healthcare, education, transportation and communications systems, etc.
The dashboard becomes an information system visualizing the information from different points of view and for different audiences and comparing the current key performance indicators (KPIs) with targets.
Looking for high-quality data visualization services? Let’s talk.
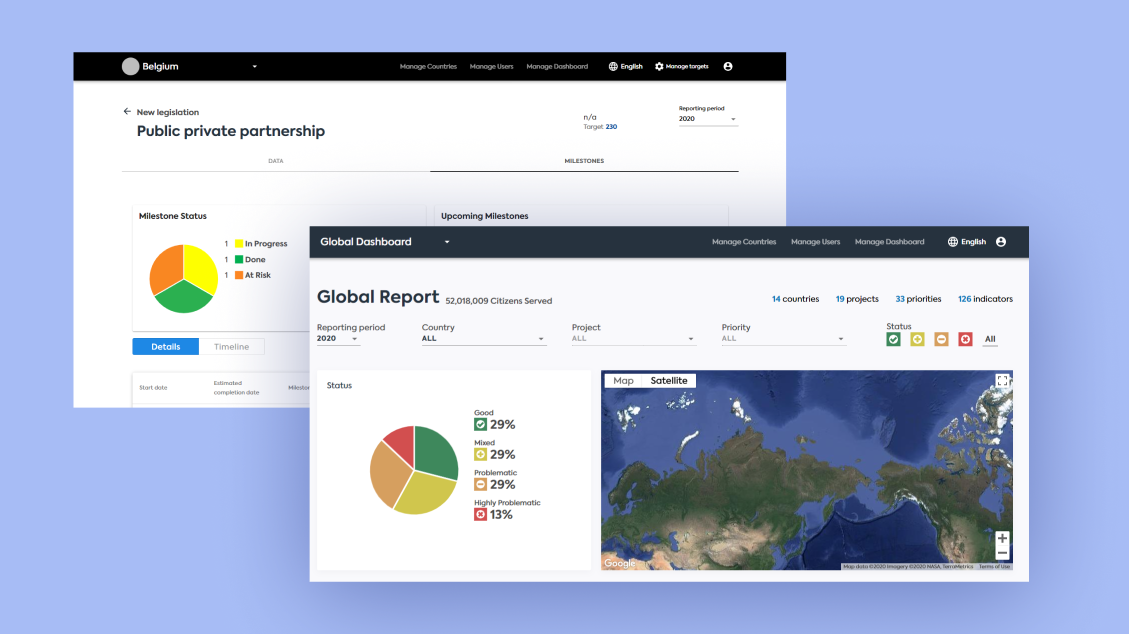
For every indicator within a project, targets and milestones are created and a customized data set is regularly uploaded. The information about indicators is reflected and updated in the dashboard, keeping the decision-makers and stakeholders equally informed of the indicators’ trends.
Admins precisely tailor the access to the application’s functionality with multiple user roles. The firstline employees collect and update the information about indicators and targets on-site and provision the data for analysis to the executives. Thus, the dashboard ensures communication and accountability along the delivery chain.
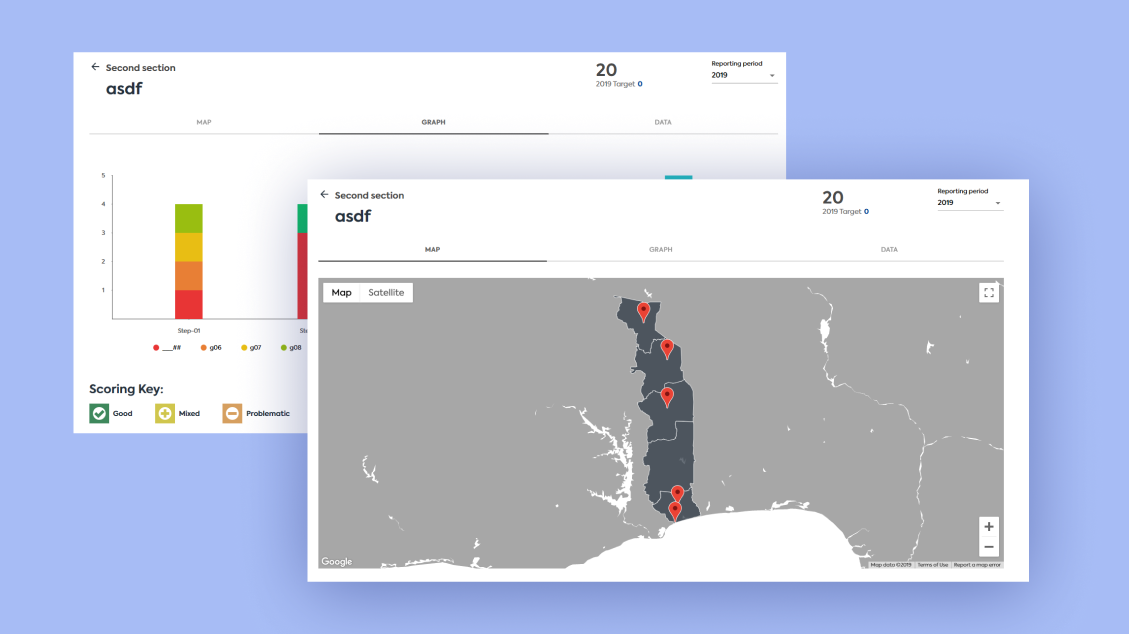
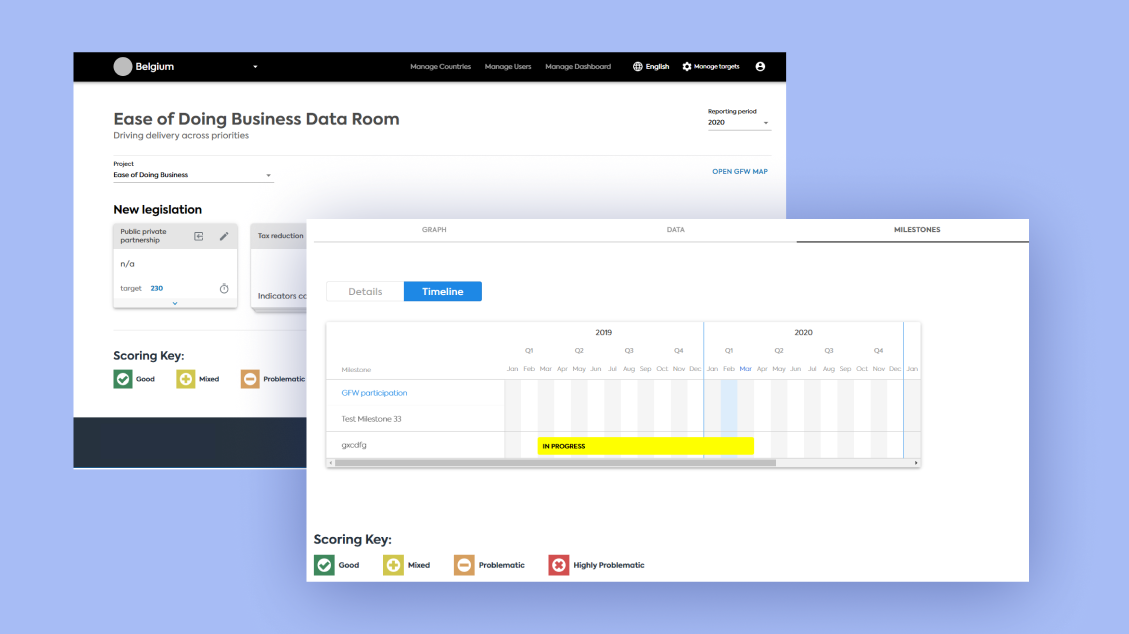
The dashboard contains maps, dynamic charts and graphs, timelines, and milestones which facilitate setting, monitoring and acting on targets.
Map explicitly shows the statistics bound to certain geographical locations.
Graphs display the key indicator movements.
For every indicator within a project, targets and milestones are created and a customized data set is regularly uploaded. The information about indicators is reflected and updated in the dashboard, keeping the decision-makers and stakeholders equally informed of the indicators’ trends.
Admins precisely tailor the access to the application’s functionality with multiple user roles. The firstline employees collect and update the information about indicators and targets on-site and provision the data for analysis to the executives. Thus, the dashboard ensures communication and accountability along the delivery chain.
Our team would love to hear from you.
Fill out the form, and we’ve got you covered.
What happens next?
San Diego, California
4445 Eastgate Mall, Suite 200
92121, 1-800-288-9659
San Francisco, California
50 California St #1500
94111, 1-800-288-9659
Pittsburgh, Pennsylvania
One Oxford Centre, 500 Grant St Suite 2900
15219, 1-800-288-9659
Durham, North Carolina
RTP Meridian, 2530 Meridian Pkwy Suite 300
27713, 1-800-288-9659
San Jose, Costa Rica
C. 118B, Trejos Montealegre
10203, 1-800-288-9659


